Our new maths
topic is...Statistics!
Today we began a new topic for maths: Statistics.
First we recalled what statistics is.
It is:
The exploration and use of patterns and relationships in data.
It involves:
Next, we began an activity called 'Choice Squares' from a Figure It Out book.
A class had gathered a set of data and had displayed the results in many different graphs.
We had to identify which graph would be the best choice to display the data given in the most informative way; the bar graph, the strip graph or the pie graph.
Room 2 decided that the bar graph was the best choice because it clearly identifies which options were most preferred, least preferred and common preferences. It is also easy to read.
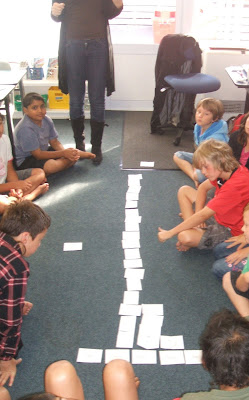
We then quickly created our own bar graph (see photos below).

We next had to decide whether a strip graph or a pie chart would be the best way to compare our results to that of the other class' (Room 8's).
We decided that the pie graph clearly identifies how many students took part in this activity in total and how many students choose each option as their preference. Often though a pie graph displays percentages and the total number of participants may not be obvious to the viewer. In this case we would use the strip graph instead as that does identify these factors.
Wow! Lots of learning in our first stats lesson.
Try making graphs here for a bit of fun.


No comments:
Post a Comment